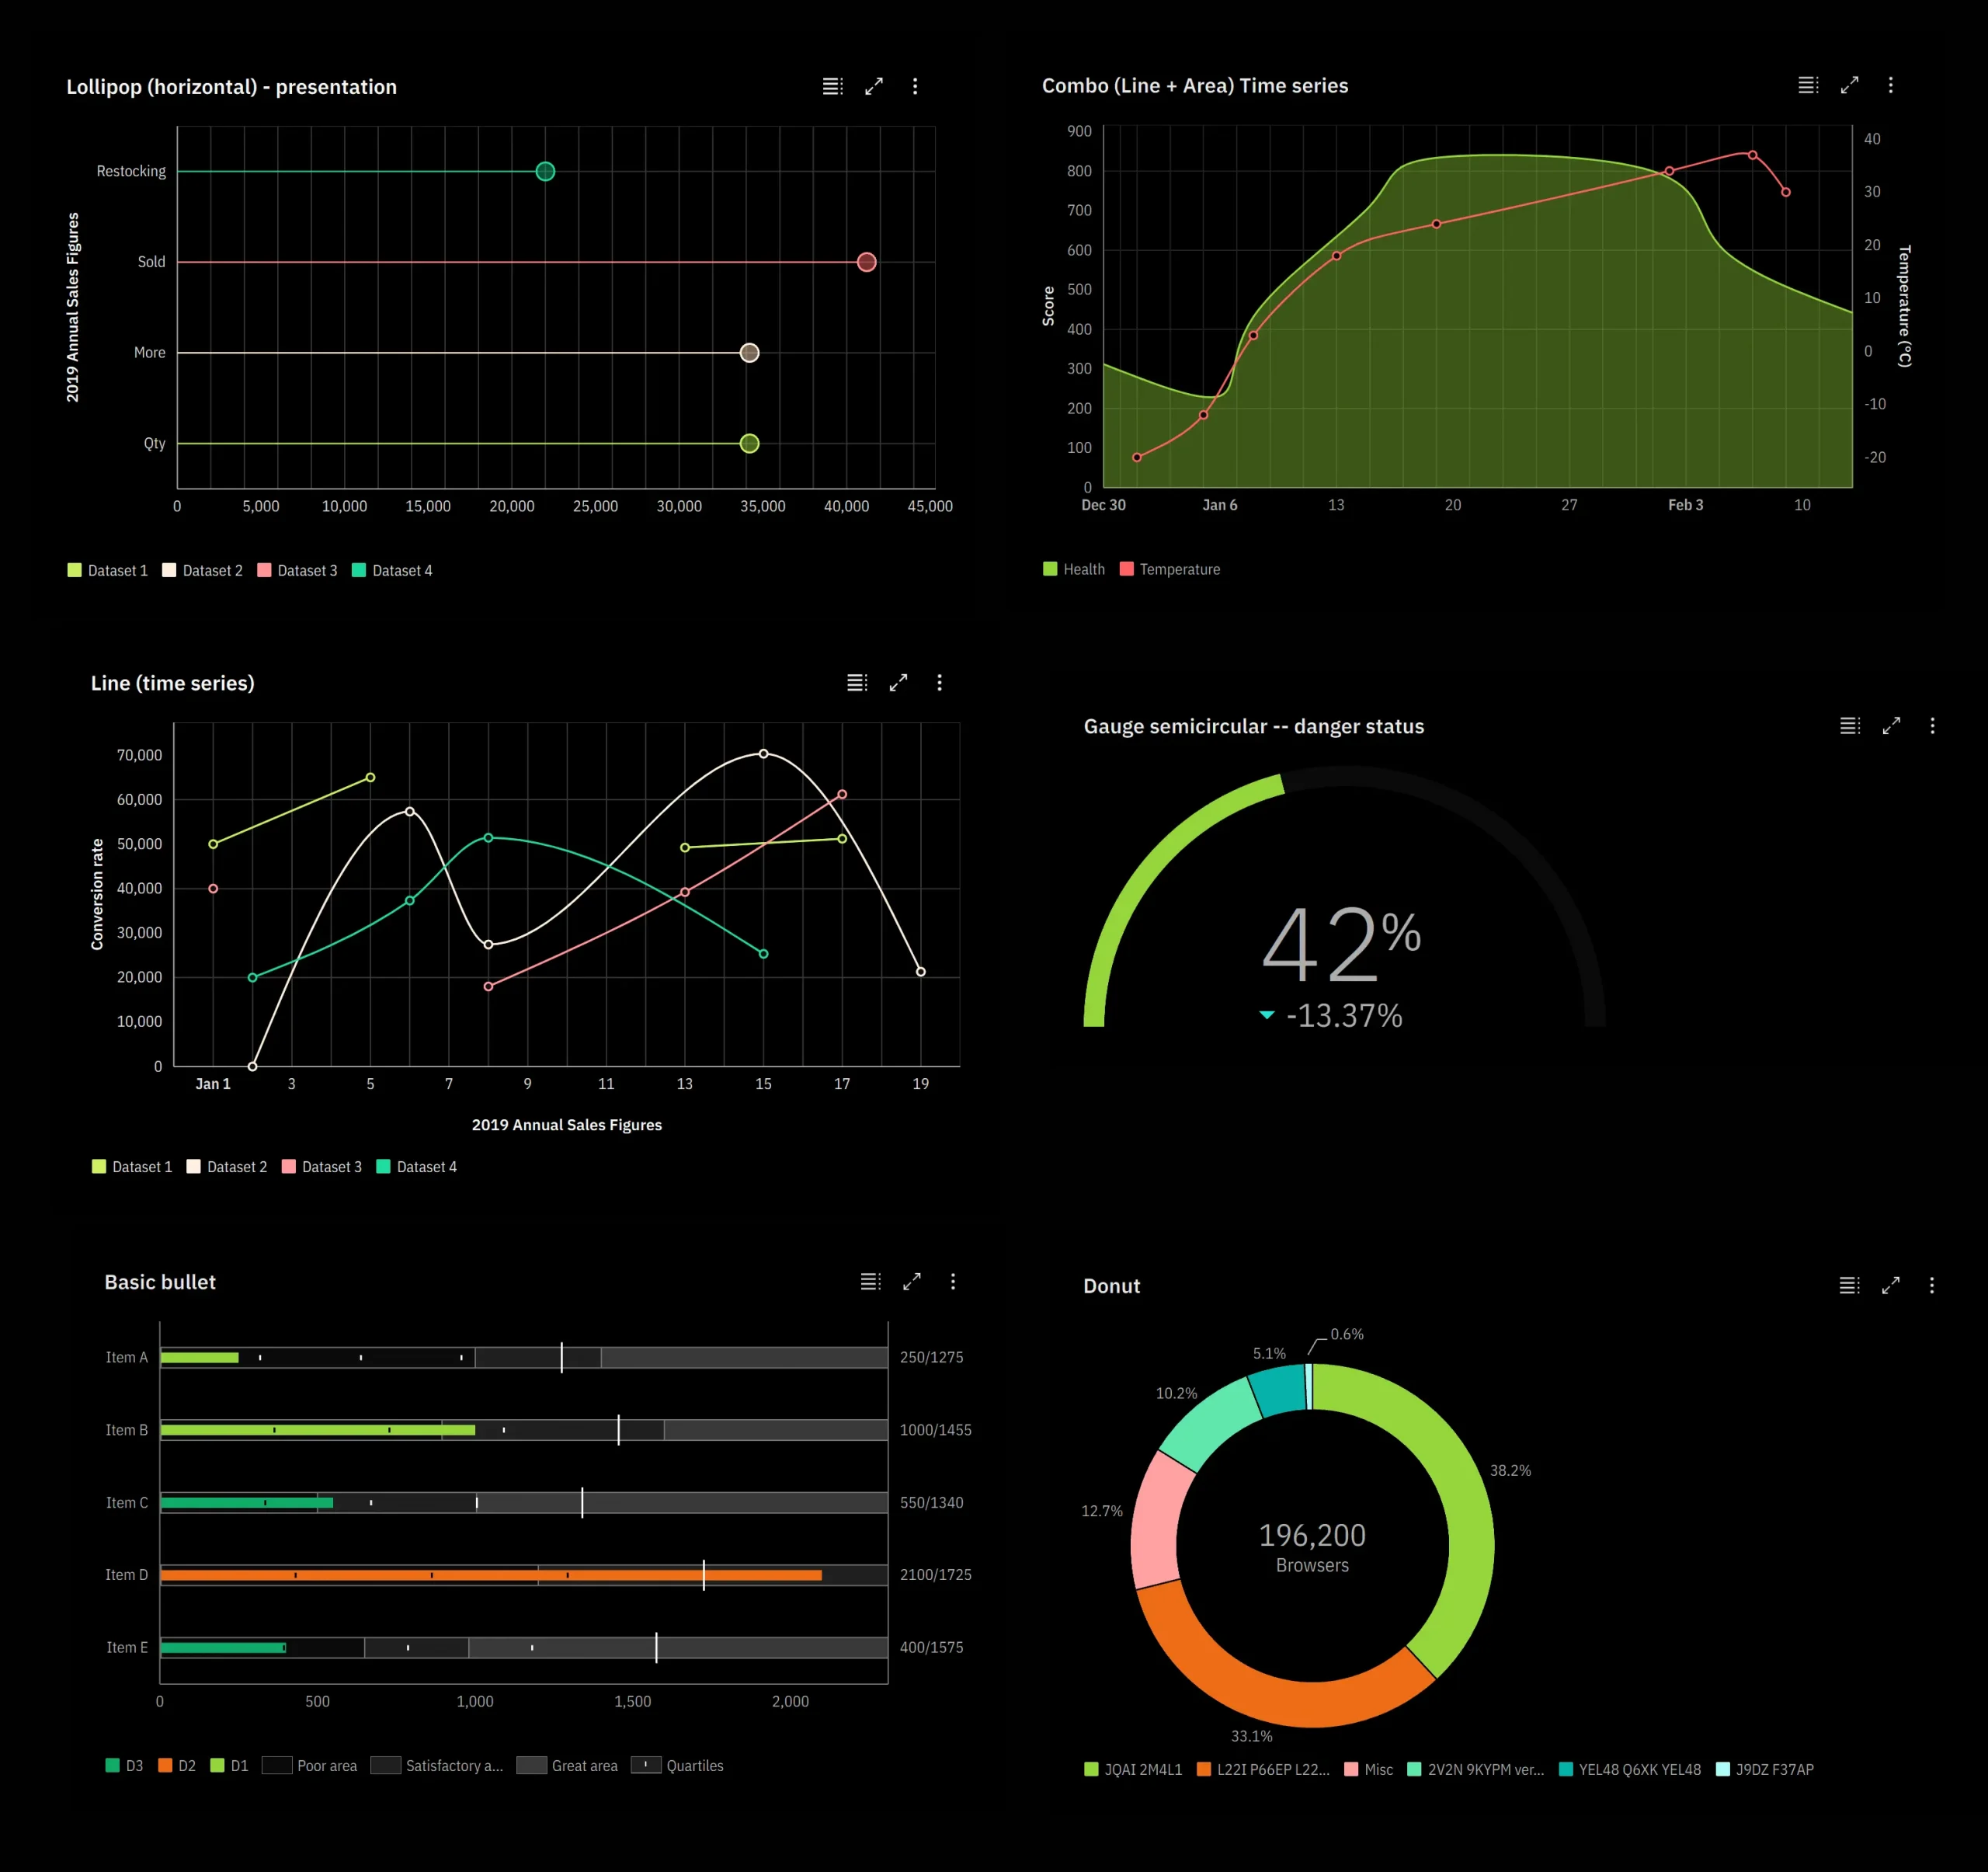
Samsung Chart Design
Charts make reading easier
Now users get more data than ever before. Charts bring dry and boring data to life and are eye-catching.
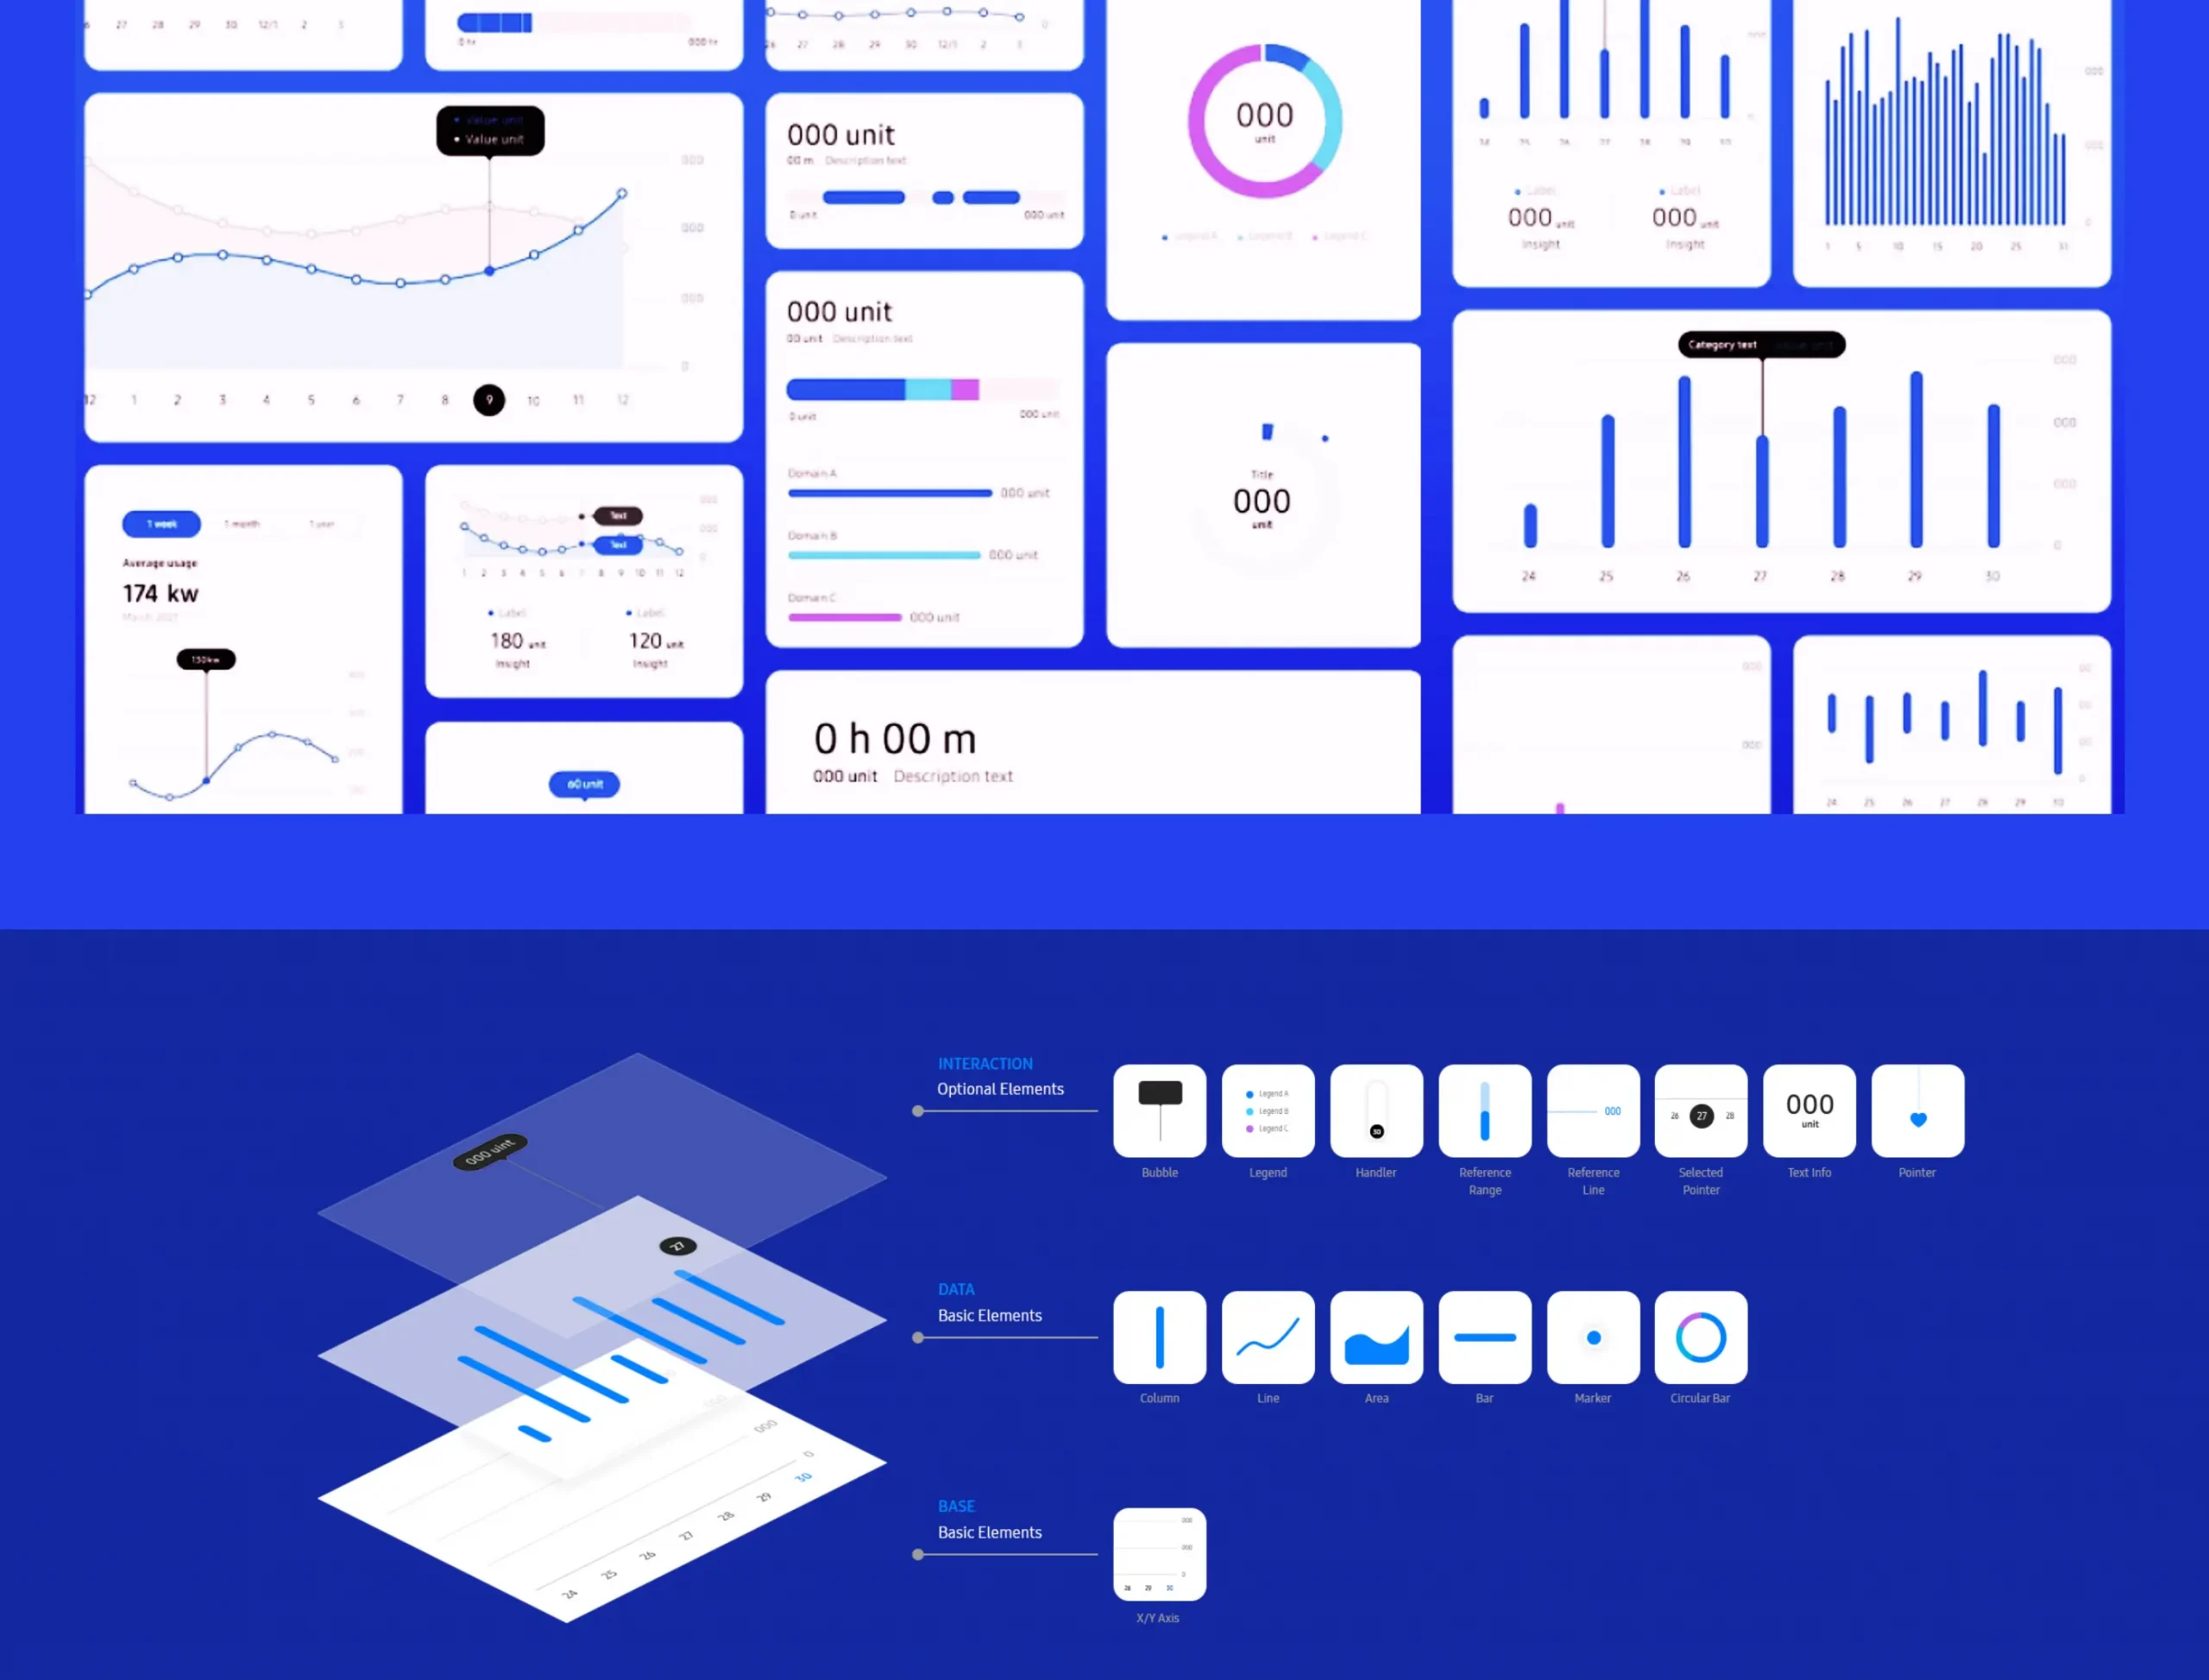
Basic principles of diagram design
Create transparency
The data is filtered and visualized with high precision to produce impressive results.
Simplicity
Important values are for expressing complex data in a simple format.
Precision
Rounded corners allow for easy integration with other design elements, and consistent data visualization improves accuracy.
Expressiveness
Each piece of data is assigned its own color and unique value. Carefully categorized data colors ensure consistency and keep values separate.

Apple Chart Design
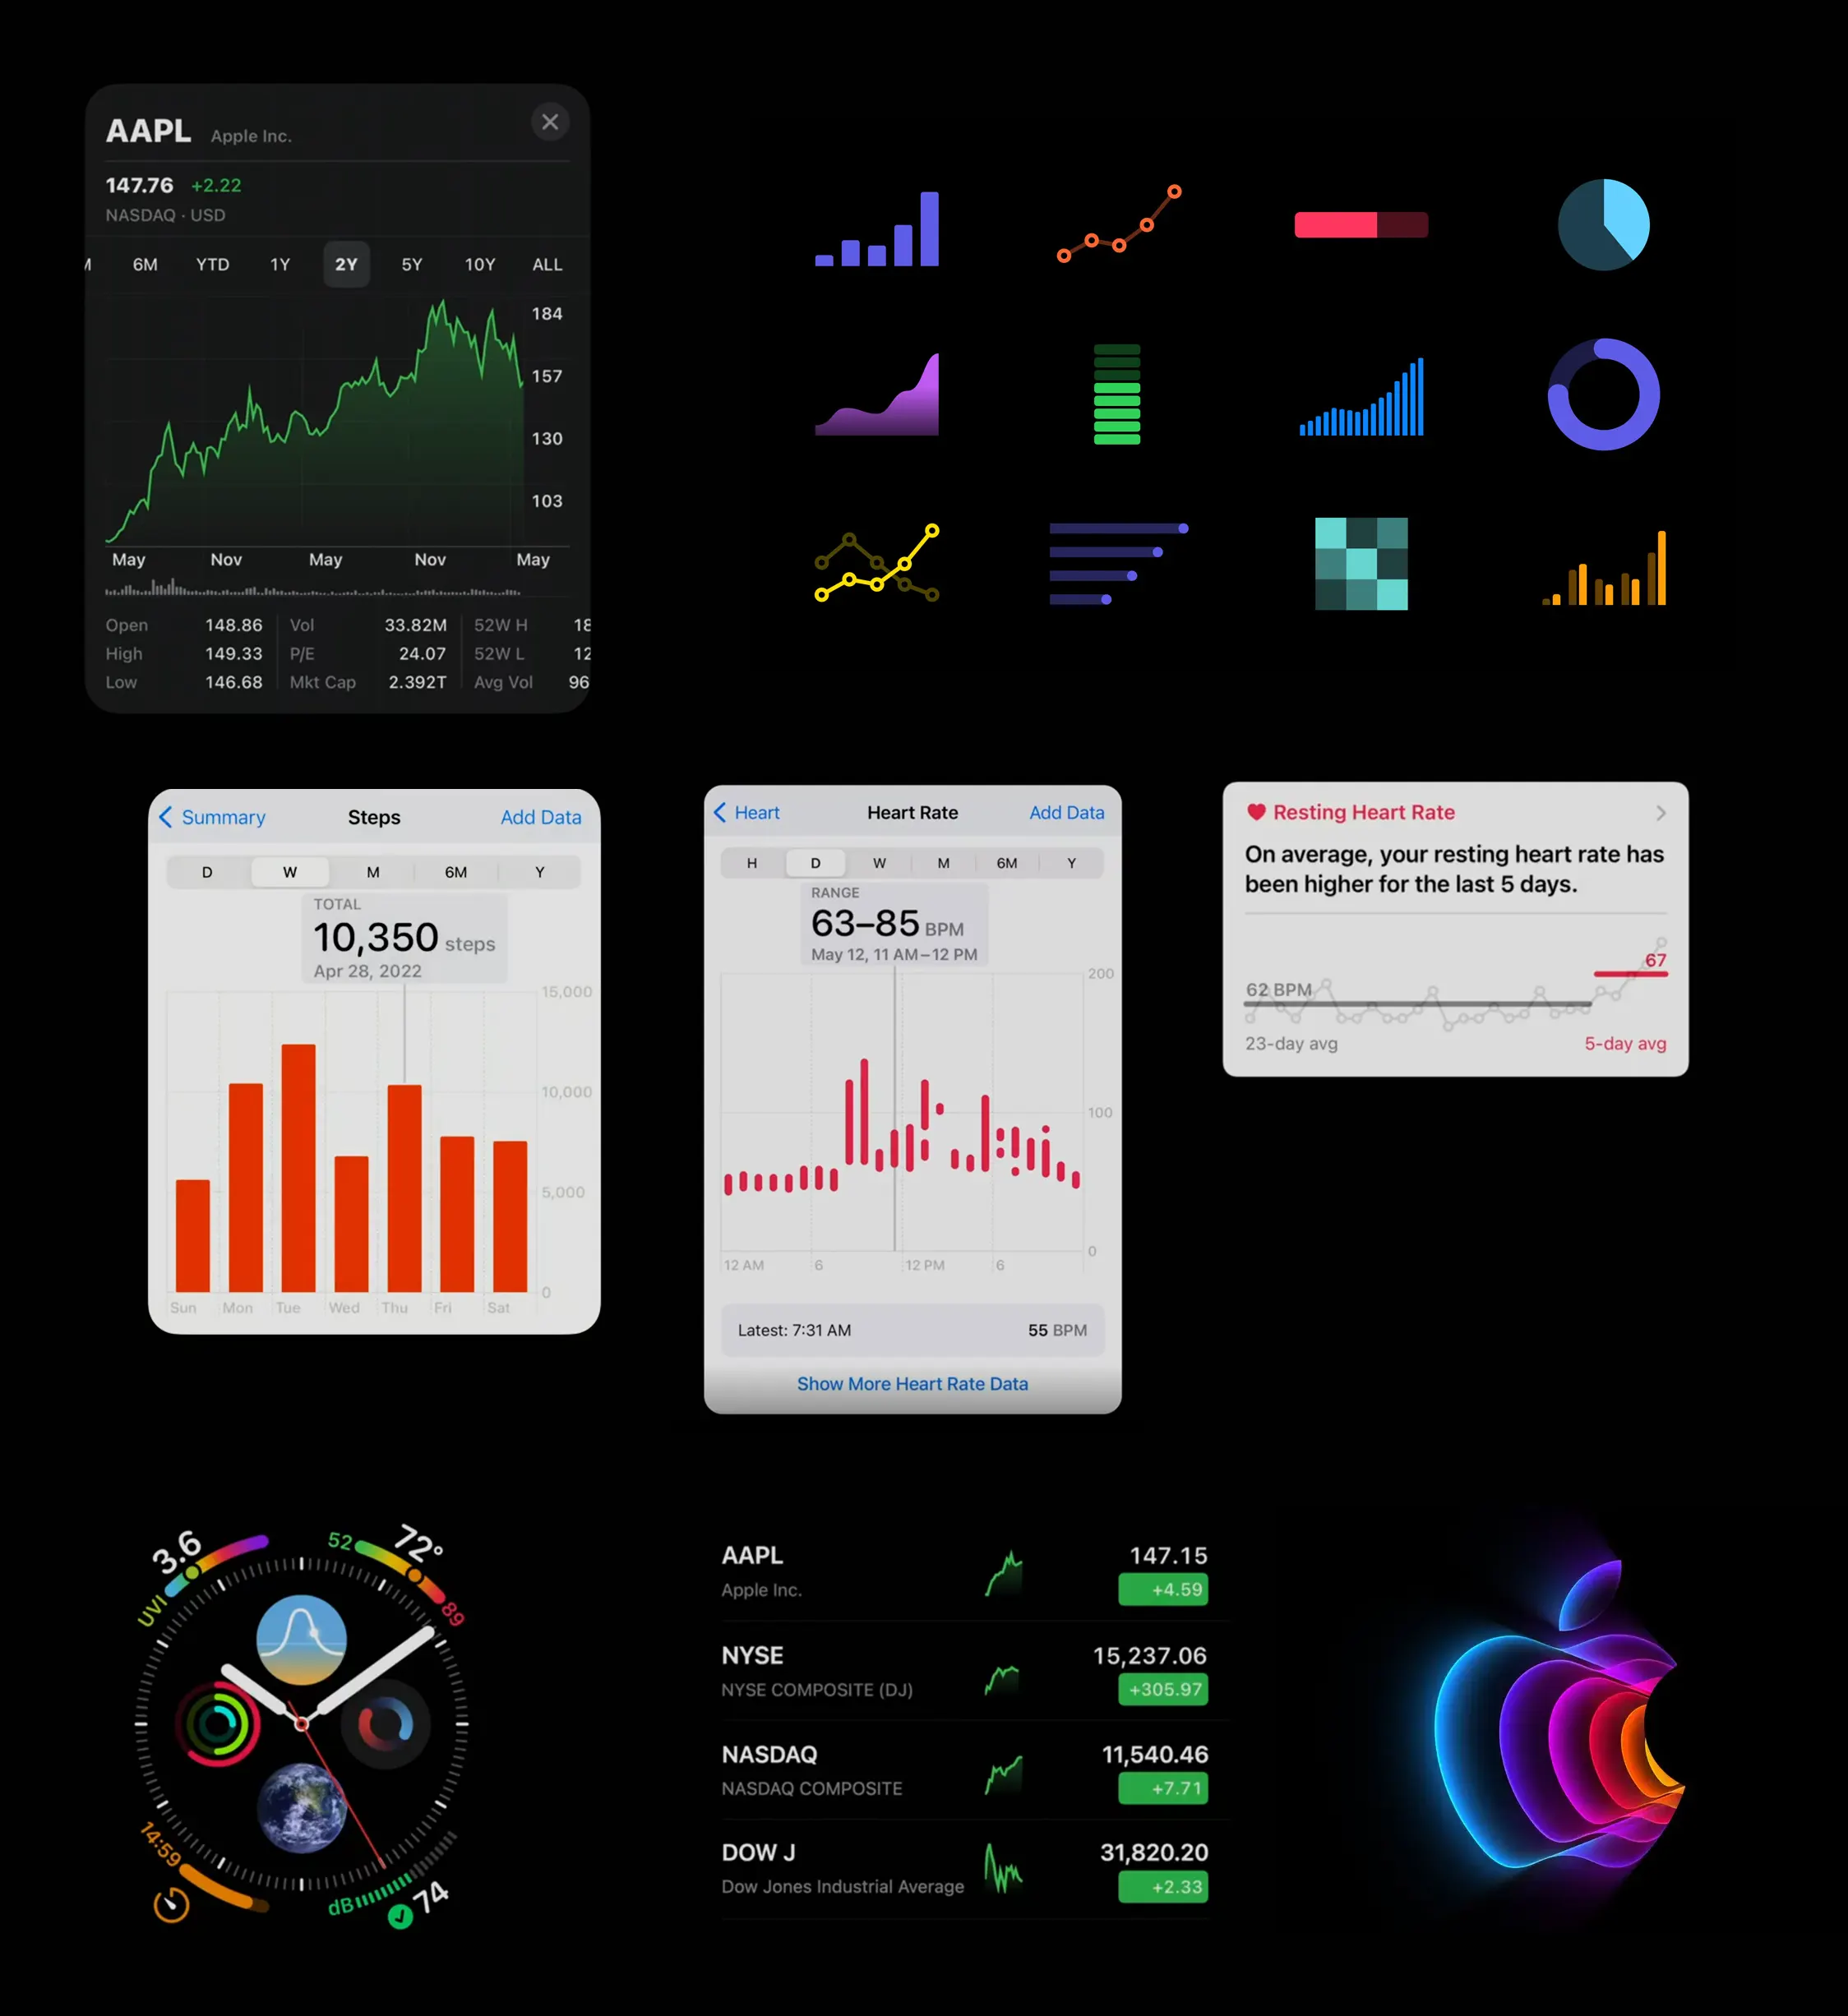

Chart in Carbon Design system
Simple charts allow you to visualize your datasets in an intuitive and easy-to-understand way. Each diagram should tell a story and display the content of the page on which it is placed.
